Everyone has opinions about society. What turns an opinion into knowledge?
Evidence that other people can check. Ask ten friends whether working during college hurts grades, and you will hear ten confident answers, each built on a few people they happen to know. Sociologists start with the same kinds of questions, but they answer them with : planned, systematic ways of collecting and analyzing information so that someone else could repeat the work and see whether they get the same result (Conerly et al., 2021).
Lesson 1 gave you the sociological imagination: the habit of looking for patterns behind personal stories. This lesson gives you the tools for testing whether a pattern is real. One example question runs through the whole lesson: do students who work long hours earn lower grades?
In one minute
- Research follows a cycle: question, past research, hypothesis, study, conclusions, report.
- A hypothesis links an independent variable (the cause) to a dependent variable (the effect).
- Two things moving together (correlation) does not prove one causes the other.
- A good sample looks like the population; a good measure is reliable and valid.
- Four main methods: surveys, field research, experiments, and secondary data.
- Ethics comes first: informed consent, confidentiality, and no harm to participants.
The cycle
Is there a step-by-step recipe for studying society?
There is a common sequence, usually called the . It traces back to Auguste Comte's hope, from Lesson 1, that society could be studied with the same care as nature. Figure 2.1 shows six steps (Conerly et al., 2021):
- Ask a question narrow enough to answer.
- Review the research. A finds what other researchers have already learned, so you do not repeat their work or their mistakes.
- State a , a testable prediction about how two or more things are related.
- Design and run a study that collects the data.
- Draw conclusions. Do the data support the hypothesis, or not?
- Report the results so that others can check them and try to repeat them.
Scroll sideways to see the whole figure.
Not every sociologist starts with a hypothesis. Some use an : they enter a group's world first, watch and listen, and let questions and explanations grow out of what they see. This approach fits Max Weber's idea of Verstehen from Lesson 1, understanding what actions mean to the people doing them (Conerly et al., 2021). Sociologists also distinguish two kinds of data. are numbers, such as hours worked or grade point average. are words, images, and observations, such as an interview about why a student took a second job.
Variables
How do you turn a vague question into something you can measure?
You name your variables and decide exactly how to count them. A is any trait that can change from person to person or over time. In a hypothesis, the is the suspected cause, and the is the outcome that depends on it. In the example, hours worked per week is the independent variable, and grades are the dependent variable.
Next comes an : a precise statement of how a variable will be measured. "Working long hours" is vague. "Working 20 or more hours a week at a paid job, as the student reports it on a survey" is operational. "Grades" becomes "the cumulative grade point average on the student's official record." Two researchers using the same operational definitions can compare their results; two researchers using their own private meanings cannot.
Cause or coincidence
If two things rise and fall together, does one cause the other?
Not necessarily. When two variables change together, they have a . A positive correlation means they move in the same direction; a negative correlation means one goes up as the other goes down. The hypothesis "more hours at work, lower GPA" predicts a negative correlation.
A correlation alone does not prove , that a change in one variable produces a change in the other. The classic example: ice cream sales and drownings rise and fall together. Ice cream does not cause drowning. Hot weather drives both, because more people buy ice cream and more people swim in summer. A hidden factor like hot weather is called a third variable, and a correlation it creates is called a (Conerly et al., 2021). Figure 2.2 draws the trap.
Scroll sideways to see the whole figure.
The same trap waits in the example question. Suppose students who work 20 or more hours a week do have lower grades. Family income could be a third variable: students from lower-income families may need to work more hours and may also have had fewer school resources before college. To claim that the work itself lowers grades, a researcher has to rule out explanations like that. Researchers do it by for the third variable, comparing students who work different hours but come from families with similar incomes.
Who you study
How can a survey of 1,000 people tell you anything about millions?
If the 1,000 are chosen the right way. The whole group a researcher wants to understand is the , for example all undergraduates in the United States. Studying everyone is almost never possible, so researchers study a , a smaller group drawn from the population.
The key is a , in which every member of the population has the same chance of being chosen. Chance spreads the sample across the whole population, so it tends to look like the population in income, age, background, and everything else, including traits the researcher never thought to measure. A convenience sample, made of whoever is easiest to reach, can be badly lopsided (Conerly et al., 2021). Figure 2.3 shows the difference.
Scroll sideways to see the whole figure.
Good measures
How do you know your measuring tool is any good?
You check it for two things. means consistency: the measure gives the same result when used again under the same conditions. means accuracy: the measure captures what it claims to measure (Conerly et al., 2021).
A bathroom scale that always reads five pounds heavy is reliable but not valid: it is consistent, and consistently wrong. In the example study, asking students to recall their GPA from memory might be less valid than using official records, because people tend to remember their grades as a little better than they were. Figure 2.4 shows the idea as shots at a target.
Scroll sideways to see the whole figure.
Four methods
Should a sociologist hand out a questionnaire, move into a neighborhood, run an experiment, or open a filing cabinet?
It depends on the question. Sociologists rely on four main methods (Conerly et al., 2021):
- Surveys ask people questions, through questionnaires or interviews. They are the most common method in sociology.
- Field research gathers data in a natural setting by watching, listening, and often taking part. It includes , joining a group's daily life in order to study it, and , a detailed description of a whole community or way of life.
- Experiments change one variable on purpose, under controlled conditions, and measure what happens to another.
- uses data that someone else already collected, such as government statistics or earlier surveys. Content analysis applies the same idea to documents and media, such as news stories or television shows.
Figure 2.5 lets you see each method at work in a real study. Choose a method.
Survey
Best for: attitudes, beliefs, and behaviors across a large population.
Real study: the General Social Survey, run by NORC at the University of Chicago since 1972, interviews a national sample of American adults about their attitudes and experiences. Because it repeats many of the same questions over decades, it shows how opinion changes over time.
Watch out for: slanted question wording, people who give the answer they think sounds good, and people who refuse to take part.
Data type: mostly quantitative.
Field research
Best for: how people actually live, in their own setting and in their own words.
Real study: for Nickel and Dimed (2001), the writer Barbara Ehrenreich worked low-wage jobs, including waitress, hotel maid, house cleaner, and retail clerk, to see whether a person could live on those wages. Earlier, Robert and Helen Lynd's Middletown (1929) described daily life in Muncie, Indiana, in detail.
Watch out for: people acting differently because they are being watched, the researcher's own bias, and results from one place that may not apply elsewhere.
Data type: mostly qualitative.
Experiment
Best for: testing cause and effect.
Real study: Devah Pager (2003) sent matched pairs of young men with equally strong made-up résumés to apply for entry-level jobs in Milwaukee. In each pair, one man was assigned a criminal record. Comparing callbacks showed how much the record, and race, changed an applicant's chances (Figure 2.6).
Watch out for: artificial lab settings, ethical limits on what can be changed, and participants who change their behavior because they know they are in a study.
Data type: quantitative.
Secondary data
Best for: large patterns, long time spans, and questions too costly to collect fresh data for.
Real study: Durkheim's Suicide (1897), from Lesson 1, compared official suicide statistics already gathered by European governments. He collected no new data himself.
Watch out for: data gathered for someone else's purpose, categories that do not match your question, and no chance to ask a follow-up.
Data type: usually quantitative; content analysis can be either.
Watching people can change what they do. In the 1920s and early 1930s, researchers at Western Electric's Hawthorne Works near Chicago studied how lighting and work breaks affected factory output. The story that grew out of those studies is that workers produced more simply because they knew they were being observed, an effect now called the . Later economists reanalyzed the original lighting data and found the effect much weaker than the legend (Levitt & List, 2011). The caution still holds: any researcher who is visible may be changing the very behavior under study.
An experiment in the field
Can an experiment show discrimination that a survey would miss?
Yes. Employers asked on a survey whether they treat applicants fairly will almost all say they do. Devah Pager tested what employers actually did. In 2001, pairs of trained young men, matched on age, appearance, and speaking style, applied for about 350 entry-level jobs in Milwaukee, Wisconsin, with résumés of equal strength. Within each pair, the men took turns presenting a criminal record. The only planned differences were the record and, across pairs, race. The outcome Pager measured was a callback, an invitation to interview or a job offer (Pager, 2003).
Figure 2.6 shows the results. A criminal record cut callbacks in half for white applicants. Black applicants with no record received fewer callbacks than white applicants with one.
Scroll sideways to see the whole figure.
This design is called an , and it shows the advantage of an experiment: because the researcher controlled everything except the variables of interest, the differences can be read as effects, not just correlations. Its limit is just as clear. The study covered one city and one kind of job in one year, so later researchers repeated audits in other cities to see whether the pattern held.
| Method | Main strength | Main weakness | Real example |
|---|---|---|---|
| Survey | Reaches many people; easy to compare answers | People may misreport; wording can steer answers | General Social Survey (since 1972) |
| Field research | Rich detail in a natural setting | Hard to generalize; observer can change behavior | Ehrenreich, Nickel and Dimed (2001) |
| Experiment | Best test of cause and effect | Can be artificial; ethical limits | Pager, Milwaukee audit study (2003) |
| Secondary data | Cheap; covers large populations and long periods | Data built for someone else's purpose | Durkheim, Suicide (1897) |
Ethics
What do researchers owe the people they study?
Honesty, safety, and respect. The rules exist because researchers have broken them. From 1932 to 1972, the U.S. Public Health Service ran the Tuskegee study of untreated syphilis in about 600 Black men in Macon County, Alabama: 399 with the disease and 201 without. Researchers never obtained the men's informed consent, and many of the men believed they were getting free government health care. Treatment was withheld even after penicillin became widely available as the standard cure in the late 1940s (Centers for Disease Control and Prevention [CDC], 2024). Public outrage over Tuskegee led to the National Research Act of 1974 and then the Belmont Report (1979), which set three principles for research with human beings: respect for persons, beneficence (do good and avoid harm), and justice (National Commission for the Protection of Human Subjects of Biomedical and Behavioral Research, 1979).
Sociology has its own cautionary case. For Tearoom Trade (1970), Laud Humphreys secretly observed men's anonymous encounters in public restrooms, wrote down their license plate numbers, found their home addresses, and later interviewed some of them in disguise as part of an unrelated health survey. The men never agreed to be studied, and exposure could have ruined their lives. The study is still taught as an example of what not to do.
Today, universities require an institutional review board () to approve research with people before it begins. The American Sociological Association's Code of Ethics (2018) asks sociologists to obtain , meaning participants know what the study involves and agree freely; to protect confidentiality; and to avoid harm. Max Weber added a further standard: , the effort to keep personal values from distorting how data are collected and reported (Conerly et al., 2021). Sociologists debate how fully anyone can meet that standard, but nearly all agree on the goal of reporting what the data show, including results they did not hope for.
Skills to keep
How can you use this the next time you see "a new study shows"?
Ask five questions before you believe or share it:
- Who was studied? A random sample of the population, or whoever was handy?
- How was it measured? Look for the operational definitions.
- Correlation or causation? If it was not an experiment, what third variable could explain the link?
- What method? Each method sees some things clearly and misses others.
- Has anyone repeated it? One study is a start. Repeated findings are knowledge.
Try it: five minutes
Pick a question you care about, for example "Does social media make teenagers lonelier?" Write a hypothesis with an independent and a dependent variable. Give each variable an operational definition. Then name one third variable that could create a spurious correlation, and choose the method from Figure 2.5 that would test your hypothesis best.
Check yourself
Check yourself
List the six steps of the research cycle in order.
Ask a question, review the research, state a hypothesis, design and run a study, draw conclusions, report the results.
In "students who work more hours earn lower grades," which is the independent variable?
Hours worked per week. Grades are the dependent variable.
Why is "working long hours" not yet an operational definition?
It does not say how the variable will be measured. An operational definition would be something like "20 or more paid hours a week, as reported on the survey."
Ice cream sales and drownings are correlated. Why is that not causation?
A third variable, hot weather, raises both. The correlation is spurious.
What makes a sample random, and why does that matter?
Every member of the population has the same chance of being chosen, so the sample tends to resemble the population, even in traits the researcher did not measure.
A scale always reads five pounds heavy. Reliable, valid, both, or neither?
Reliable but not valid: consistent, but consistently wrong.
Which method is best for testing cause and effect?
An experiment, because the researcher changes one variable on purpose and controls the others.
What did Pager's audit study find for Black applicants with no criminal record?
They received fewer callbacks (14 percent) than white applicants with a criminal record (17 percent).
Name the three principles of the Belmont Report.
Respect for persons, beneficence, and justice.
Flashcards
Tap a card to flip it. Say the answer out loud before you tap.
HypothesisTap to flip
A testable prediction about how two or more variables are related.
Independent vs. dependent variableTap to flip
The suspected cause vs. the outcome that depends on it.
Operational definitionTap to flip
Exactly how a variable will be measured.
Spurious correlationTap to flip
A link between two variables that is really caused by a third variable.
Random sampleTap to flip
Every member of the population has an equal chance of being chosen.
ReliabilityTap to flip
Consistency: the same result each time under the same conditions.
ValidityTap to flip
Accuracy: the measure captures what it claims to measure.
Participant observationTap to flip
Joining a group's daily life in order to study it.
Hawthorne effectTap to flip
People change their behavior because they know they are being studied.
Informed consentTap to flip
Participants know what a study involves and agree freely to take part.
Check yourself with a quick quiz
A few questions on this lesson only. Questions you miss come back later. Progress stays in this browser and is shared with the full quiz.
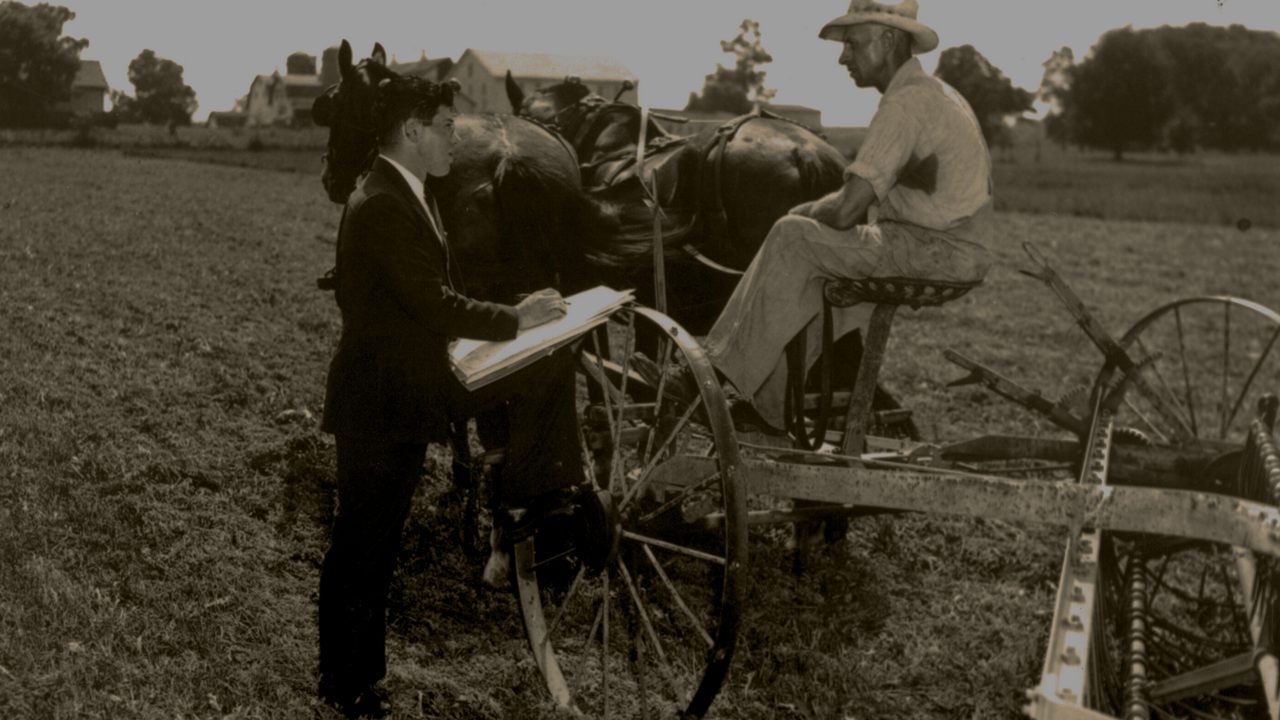
Top image: U.S. Census Bureau enumerator interviewing a farmer for the 1940 census. U.S. Census Bureau. Public domain.
References
- American Sociological Association. (2018). Code of ethics. https://www.asanet.org/about/ethics/
- Centers for Disease Control and Prevention. (2024). About the untreated syphilis study at Tuskegee. https://www.cdc.gov/tuskegee/about/index.html
- Conerly, T. R., Holmes, K., & Tamang, A. L. (2021). Introduction to sociology 3e. OpenStax. Chapter 2, Sociological research. https://openstax.org/books/introduction-sociology-3e/pages/2-introduction
- Durkheim, E. (1951). Suicide: A study in sociology (J. A. Spaulding & G. Simpson, Trans.). Free Press. (Original work published 1897)
- Ehrenreich, B. (2001). Nickel and dimed: On (not) getting by in America. Metropolitan Books.
- Humphreys, L. (1970). Tearoom trade: Impersonal sex in public places. Aldine.
- Levitt, S. D., & List, J. A. (2011). Was there really a Hawthorne effect at the plant where it was first discovered? American Economic Journal: Applied Economics, 3(1), 224-238. https://doi.org/10.1257/app.3.1.224
- Lynd, R. S., & Lynd, H. M. (1929). Middletown: A study in contemporary American culture. Harcourt, Brace.
- National Commission for the Protection of Human Subjects of Biomedical and Behavioral Research. (1979). The Belmont report: Ethical principles and guidelines for the protection of human subjects of research. U.S. Department of Health, Education, and Welfare. https://www.hhs.gov/ohrp/regulations-and-policy/belmont-report/index.html
- NORC at the University of Chicago. (n.d.). General Social Survey. Retrieved October 3, 2026, from https://gss.norc.org/
- Pager, D. (2003). The mark of a criminal record. American Journal of Sociology, 108(5), 937-975. https://doi.org/10.1086/374403
- U.S. Census Bureau. (1940). 1940 census enumeration [Photograph]. Public domain, via Wikimedia Commons. Page image cropped and darkened. https://commons.wikimedia.org/wiki/File:1940_Census_Enumeration_(5020520332).jpg
Image and media credits
- Top image. A U.S. Census Bureau enumerator interviewing a farmer for the 1940 census, cropped and darkened. A census interview is a real example of the survey research this lesson teaches. Source: U.S. Census Bureau, via Wikimedia Commons. License: Public domain (U.S. government work).
- Read-aloud audio. Narration of this page. It lets you listen to the lesson instead of reading it. Source: Created for this site: this page's text read by a computer-generated voice (Microsoft text-to-speech, Andrew voice). License: Our own text; the synthetic voice is Microsoft's.
- Diagrams and interactive figures. Every diagram and interactive figure on this page. They show the ideas in the text step by step. Source: Created for this site. License: Original to mattgaugerx.com.

.jpg)